

There is an updated and much better version of this web page here: https://infovoice.se/choosing-statistical-analysis/.
| Suggested pre-reading | What this web page adds |
|---|---|
| This web page provides a brief overview of different statistical methods and when to use them. After reading this page (a couple of times) you are likely to understand the most common choices involved in picking a suitable statistical method. It is likely that you also can pick a suitable statistical method for your project. |
The birds perspective
Statistics consists of two main parts; descriptive statistics and inferential statistics. Descriptive statistics try to describe the observations, usually by describing the central tendency and the dispersion from the central tendency. Inferential statistics try to make conclusions from your observations.
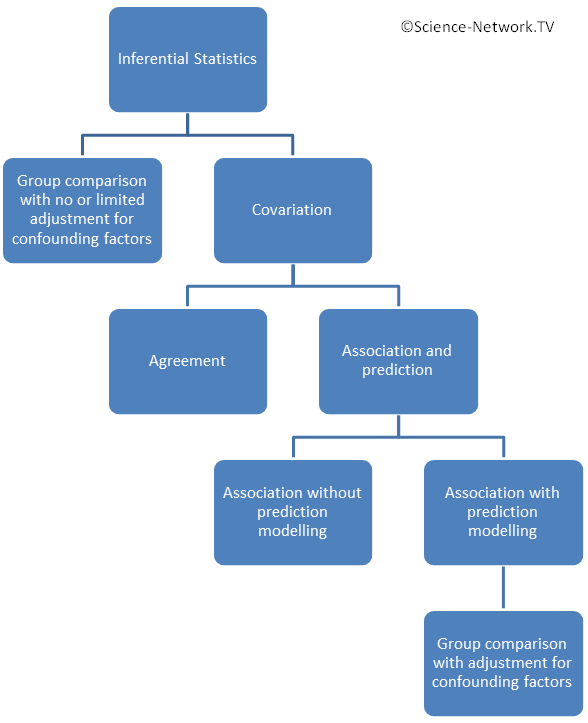
This page will focus on choice of statistical method for the inferential statistics. The figure to the right gives a birds perspective of the different approaches in inferential statistics. The two main approaches are:
- Group comparisons (one group towards a fix value, matched groups or unmatched groups) with no or limited adjustment for confounding factors.
- Analyzing covariation in one single group.
Statistical methods used in inferential statistics can be split into parametric or non-parametric methods. Once you have had a look at the descriptive statistics the next step would be to decide if the inferential statistics should use parametric or non-parametric methods (follow this link before you continue to read here). The ground rule is to use parametric methods for the inferential statistics if your observations fulfill all requirements for using parametric methods, otherwise use non-parametric methods. Parametric methods are slightly more “sensitive” to find what you are looking for. It is quite common that within the same study some observations can be analysed using parametric methods while others require non-parametric methods.
Group comparison or analyzing association with prediction models?
It can be shown that doing a simple group comparison and evaluating the same scenario using association with prediction modelling (usually some sort of regression) will provide the same results. It can be shown that most group comparisons can be considered as a special case of association with prediction modelling. Does it matter if I use the approach of direct group comparison or the approach of association with prediction modelling? Yes it does! It is quite common that there are confounding factors that influence the outcome of a group comparison. Example of such confounding factors can be gender, age, being a smoker, having diabetes, etc etc. If you go down the path of doing a simple group comparison you might want to adjust for this by doing sub-group analysis for different combinations of gender, age group, having diabetes, being a smoker, etc. However, this approach results in a couple of important problems:
- You need to make quite a lot of separate analysis leading to many p-values. Let us assume an example where we have three separate outcome (effect) variables to estimate a difference between groups. Let us assume they are reduction in mortality, reduction in the proportion of patients experiencing a heart attack and reduction in cholesterol level. This means three p-values (if we use p-values as our measure for difference between groups). If we also want to adjust for any subgroup of gender, age (below or above 65 years), having or not having diabetes and being or not being a smoker we would have to calculate 3*2*2*2*2=48 p-values. This invokes a need to adjust the level of significance for multiple testing. With many subgroups you will soon find that the magnitude of adjustments for multiple testing makes it very difficult (sometimes almost impossible) to find a difference between groups.
- Splitting your sample in many subgroups also gives fever observations for each sub-group analysis and your study is likely to be grossly underpowered.
The alternative is to use a statistical method that can incorporate all variables in one go and tell the importance of them. You would do one separate analysis for each outcome variable (they would be labelled as dependent variable) and include all other variables (including group allocation) as independent variables. In the same example as above we would get 3*(1+1+1+1+1)=15 estimates such as p-values, odds ratios or hazard ratios. The magnitude of the adjustment for multiple testing you need to do for simultaneously producing 15 p-values is much less than if you produce 48.
The conclusion is that you should use simple group comparison if you have no need at all to adjust for confounding variables. This only occurs in the situation of a properly conducted randomized controlled trial. In all other situations (and also in some randomized controlled trials) you would be far better off choosing the approach of analyzing association using techniques also allowing the creation of prediction models (see below). This is very important in the case of retrospective studies (such as retrospective chart reviews) where confounding factors virtually always exists.
Important considerations in different scenarios
Randomized Controlled Trials (RCT)
The main purpose of the randomization procedure is to eliminate systematic bias. The main purpose with randomization is not to create groups that are similar at baseline. However, that is usually a desirable side effect of the randomization. A baseline difference can still occur by pure chance and it is sometimes adjusted for using statistical methods for “association with the possibility for creating prediction models” (see below). If that is done you would make group allocation to be one of the independent variables and the baseline variable where there is a difference between groups would be another independent variable.
Evaluating tests with a dichotomous outcome (screening tests or diagnostic tests)
A gold standard is necessary for calculating sensitivity, specificity, likelihood ratios and predictive value of tests. It is either the accepted reference method or the best known predictor of the truth, hopefully both. A common situation is that presence of a marker that the test is constructed to find (such as a bacterium) does not necessarily mean that the individual has a specified disease (defined as symptoms and signs caused by the bacterium). In this situation we must realize that there is a difference between predicting the presence of a marker and predicting the presence of a disease. Is the gold standard showing the presence of a marker or the presence of a disease caused by the marker? If the test indicates presence of a marker that may cause a disease as well as being a commensal it could be confusing as to what is actually being predicted. Thus, it is obvious that the question of the appropriateness of the gold standard ought to be discussed in every evaluation of a test. Assume that we want to compare a new really good test with a traditionally accepted gold standard. If the new test is better than the old gold standard it would be perceived as having a poos sensitivity and specificity merely because we defined the old test as representing the truth. Reversing this definition and label the new test as gold standard would suddenly allocate poor sensitivity and specificity to the old test. Remember that definition of the gold standard is an important part of test evaluations.
Sensitivity and specificity informs you about “the health of the diagnostic test”. Likelihood ratio informs how much more information was added by the test. Finally, predictive value of tests informs you about the health of your patients (if patients are at focus). Hence, sensitivity and specificity are of uttermost importance for manufacturers of diagnostic tests while predictive value of test are much more useful for health care staff.
Case control studies or cohort studies (often conducted as retrospective chart reviews)
A common situation is that you want to know if a new treatment (or routine) is better than the old one. Let us discuss some examples. The first example is a hospital clinic that changed their approach to keeping the vascular access open in patients with end stage renal disease. Keeping the vascular access open is essential for dialysis to work. You are given the task to compare the outcome before and after as a proof that one approach (hopefully the current) is better than the other. Another example could be that patients with type two diabetes for various reasons are given different drug treatments of drugs generally approved and widely used. You are given the task of investigating if patients given the new drug A has a better outcome than those getting the traditional drug B. Both these examples has some common features. None of them are a randomized controlled trial. They are both usually conducted as retrospective chart reviews (or at least part of the data collection is retrospective). The main problem is that patients are not randomized to the different treatments / approaches. The consequence is that you end up comparing two groups that may not be comparable. Any differences in outcomes may be due to these differences rather than the different treatments. It is likely that the latter situation with diabetes will suffer more from this problem than the first situation with end stage kidney disease where all patients are swapped over. This problem cannot be completely eliminated and this design will be considered as a vastly inferior design compared to a proper randomized controlled trial. However, retrospective charts are data that are usually easily accessible and almost just waiting there so these types of studies are common. It is important to realize that a simple group comparison with no or limited adjustment for confounding factors is insufficient. The best approach is to use statistical methods for “analyzing association with the possibility for creating prediction models“. These methods allows adjustment for known confounding factors. It is of course difficult to adjust for unknown confounding factors. Example of suitable statistical methods are unconditional binary logistic regression, multivariable linear regression or propensity score matching.
Establishing an association with the possibility for creating prediction models (prospectively or retrospective)
It is very common that you want to predict the probability for or time to an event. What you want to predict will be your outcome variables. It might be death, deterioration, improvement, quality of life etc. You would look at a number of other variables that correlates with your outcome. You need to do this separately for each outcome variable. You would likely want to use logistic regression in case your outcome variable is binary. If it is time to an event you would typically choose Cox regression.
Estimating associations are usually a good alternative to do a case-control study. Group allocation would in such cases be one of several independent variables. The interpretation of the outcome is not cause-effect but rather associations where the cause-effect needs to be clarified in proper randomized controlled trials.
Specific advice on choosing statistical method
Analyzing association between two variables (with no need for prediction)
| Scale of measure | Suitable statistical test |
|---|---|
| Nominal with two categories (dichotomous) | Contingency coefficient |
| Phi coefficient | |
| Craemer's Phi coefficient = Craemer's V coefficient | |
| Relative risk (RR) | |
| Odds ratio (OR) | |
| Nominal with more than two categories | Craemer's Phi coefficient = Craemer's V coefficient |
| Ordinal (has an order but not equidistant scale steps) | Spearmann’s rank correlation coefficient |
| Kendall’s coefficient of concordance = Kendall’s tau | |
| Somer’s D | |
| Interval scale or Ratio scale | Pearson’s correlation coefficient |
Analyzing association with the possibility for creating prediction models
| Dependent variable | Observations | Suitable statistical test |
|---|---|---|
| Nominal with two categories (dichotomous) | independently chosen observations | Unconditional binary logistic regression |
| Propensity score matching | ||
| Independently chosen matched pairs | Conditional binary logistic regression | |
| Nominal with more than two categories | independently chosen observations | Multinominal logistic regression (=multiclass logistic regression) |
| Ordinal (has an order but not equidistant scale steps) | independently chosen observations | Ordered logistic regression (=ordinal regression). Also possible to introduce a cut-off and use unconditional binary logistic regression |
| Interval or ratio scale | Independently chosen observations with only one independent variable | Simple linear regression (labelled analysis of covariance if the independent variable is dichotomous) |
| Independently chosen observations with more than one independent variable | Multivariable linear regression (labelled analysis of covariance if the independent variable is dichotomous) | |
| Propensity score matching | ||
| Time to an event (this is a special case of Interval or ratio scale) | Independently chosen observations with more than one independent variable | Cox proportional hazards regression |
Simple group comparisons – Overview
- Establish how many separate variables (factors) are used to allocate observations to a group.
-Zero factor design: No variables are used for group allocation. This means that a single group is compared either to a fix predefined value or a pre-post comparison is made.
-One factor design: It is considered a one factor design if one variable is used to allocate observations to separate groups. A common example is if two or more independent groups are compared. One factor design is the most common situation in group comparisons.
-Two factor design: If two factors (such as type of treatment and timing) are used for group allocation. If each factor had two categories we would get a two-factor design with four separate groups. It would still be a two factor design if each factor had three categories but now we would have nine groups.
-N-factor design: There are study designs using more than two factors / variables for group allocation. They are rare (and complicated). - If the design has at least two groups (are at least a one factor design) are groups matched or unmatched?
- What scales of measure is appropriate for the observations you have?
- If the interval or ratio scales are appropriate for some variables are these observations normally distributed or not?
- If any variables are measured with the nominal scale are the different possible labels only two (making it dichotomous) or are more than two labels possible?
Simple group comparisons – Zero factor design
(This section is still under construction. Sorry for the inconvenience.)
Simple group comparisons – One factor design – Unmatched groups
| Scale of measure | Suitable statistical test | Comment |
|---|---|---|
| Nominal with two categories (dichotomous) | Chi-square | Requires at least five observations in each cell |
| Fisher's exact test | Robust with few requirements | |
| Nominal with more than two categories | Chi-square | Requires at least five observations in each cell |
| Ordinal (has an order but not equidistant scale steps) | Mann-Whitney's test = Wilcoxon two unpaired test = Rank sum test | Very common test |
| Fisher's permutation test | ||
| Cochran–Mantel–Haenszel (CMH) test | ||
| Interval or ratio scale not fulfilling requirements for parametric testing (often due to skewed observations) | Mann-Whitney's test = Wilcoxon two unpaired test = Rank sum test | Very common test |
| Fisher's permutation test | ||
| Cochran–Mantel–Haenszel (CMH) test | ||
| Z-test | ||
| Interval or ratio scale fulfilling requirements for parametric testing (such as being normally distributed) | Student's t-test - two sample unpaired test | Very common test. Only for two independent groups. |
| One way analysis of variance | Can be used if there are more than two independent groups in a one factor design. Will give the same result as t-test if there are only two groups. | |
| Cohen's d | ||
| Z-test | ||
| Time to an event (this is a special case of Interval or ratio scale) | Log rank test = Mantel–Cox test = time-stratified Cochran–Mantel–Haenszel test | Can include more than two groups. Cox proportional hazards regression is the preferred method if there is a need to adjust for confounding variables. |
| Kaplan-Meyer curves | This is a graphical representation |
Simple group comparisons – One factor design – Matched groups
| Scale of measure | Suitable statistical test | Comment |
|---|---|---|
| Nominal with two categories (dichotomous) | McNemars test | |
| Nominal with more than two categories | ||
| Ordinal (has an order but not equidistant scale steps) | Signs test | |
| (McNemars test) | Signs test is better but McNemars test will work and give a very similar result. | |
| Interval or ratio scale not fulfilling requirements for parametric testing (often due to skewed observations) | Signs test | |
| (McNemars test) | Signs test is better but McNemars test will work and give a very similar result. | |
| Interval or ratio scale fulfilling requirements for parametric testing (such as being normally distributed) | Student's t-test - one sample unpaired test | Very common test. Only for two matched groups. |
| One way ANOVA with repeated measures | When individuals are matched, measurements from matched individuals are treated like repeated measures. Can be used if there are more than two matched groups in a one factor design. Will give the same result as one sample t-test if there are only two groups. |
Simple group comparisons – Two factor design
(This section is still under construction. Sorry for the inconvenience.)
Analyzing agreement (evaluation of a diagnostic tests)
| Scale of measure | Suitable statistical test | Comments |
|---|---|---|
| Nominal with two categories (dichotomous) | Cohen's kappa coefficient | |
| Sensitivity and Specificity | Tells you about the health of the diagnostic test | |
| Likelihood ratio | Tells you how much more information a test adds | |
| Predictive value of test | Tells you about the health of the patient (if your test is about patients and their health) | |
| Etiologic predictive value | Predictive value of test while adjusting for possible carriers ill from another agent than the test is looking for. Does not require a gold standard. | |
| Nominal with more than two categories | Cohen's kappa coefficient | |
| Ordinal (has an order but not equidistant scale steps) | Cohen's kappa coefficient | |
| Weighted kappa coefficient | ||
| Interval scale or Ratio scale | Limits of agreement | Often combined with Bland-Altman plot |
| Bland-Altman plot = Difference plot = Tukey mean-difference plot | This is a graphical representation of comparing two tests | |
| Lin's Concordance correlation coefficient | ||
| Intra class correlation (=ICC) | (usually better to use one of the above methods) |
[cite]