

[cite]
| Suggested pre-reading | What this web page adds |
|---|---|
| This web page describes the part of statistics aiming to draw conclusions from observations. You will have a brief understanding of the main types of statistical methods available after reading this web page. |
Statistics consists of two main parts; descriptive statistics and inferential statistics. Descriptive statistics try to organize and summarize the observations while inferential statistics try to make conclusions from the observations. This web-page will focus on inferential statistics. Inferential statistics usually results in two types of outcomes:
- An effect size of some kind. It can be a measure of difference between two groups (such as average mean difference with a 95% confidence interval). It can be an odds ratio, a hazards ratio, a correlation coefficient or a beta coefficient in the situation of association with prediction modelling.
- An evaluation of the null hypothesis presented as a p-value.
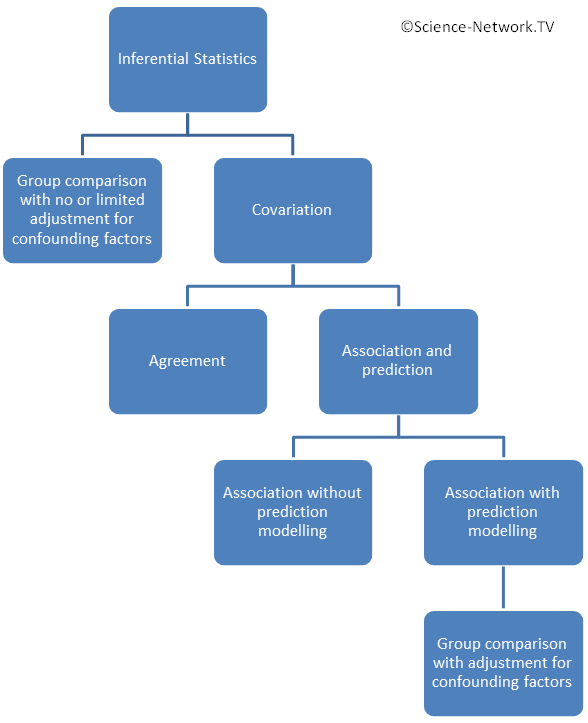
The figure gives a birds perspective of the different approaches in inferential statistics. The two main approaches are:
- Group comparisons (one group towards a fix value, matched groups or unmatched groups) with no or limited adjustment for confounding factors.
- Analyzing covariation in one single group.
You can read more about group comparisons and covariation on the web page choosing statistical analysis.
The null hypothesis
A philosopher named Karl Popper invented the idea that a scientific truth is only temporarily true if we can define a study that could falsify the theory. A scientific truth remains true until we can falsify it. Hence all truth are just temporary awaiting the study that falsify it. The statistical null hypothesis comes from this philosophical idea.
The null hypothesis defines a hypothesis of no finding (no difference between groups or no association between two variables). Hypothesis testing in inferential statistics is to calculate the probability to obtain our observations under the assumption that the null hypothesis is correct. A low p-value means that it is a low probability of getting our observations and we can subsequently falsify the null hypothesis.
A p-value is often calculated for group comparisons but also for regression analysis where the null hypothesis is that there is no association between variables. The p-value attached to an odds ratio or a hazards ratio states the probability of getting your odds ratio or hazards ratio assuming that the true value is 1.0 (=no association).
The difference between level of significance (alpha) and the p-value
A low p-value says it is unlikely that we would get the observed observations if the effect / correlation we’re looking for in reality is zero. A low P value indicates that the null hypothesis can be rejected and the alternative hypothesis is the most likely. How low must the p-value be for us to believe that our alternative hypothesis is the most plausible? This should be determined from case to case and is called the level of significance or alpha. Read more about this on our page Level of significance.
We use inferential statistics to calculate a p-value. Next step is to compare our calculated p-values (the probability of getting the observed values) to see if they are below or above the predetermined level of significance (alpha). We can reject the null hypothesis and consider the alternative hypothesis to be most likely if our p-value is below the predetermined alpha. The null hypothesis can not be rejected in the opposite case with a higher p-value and the result do not contradict that the null hypothesis is true.
If we find p <0.05 it means that the risk of doing wrong when we claim a statistical finding is <5%. However, it is important to keep in mind that the limit 0.05 is not black and white. a finding of p=0.055 or p=0.045 is very similar. By tradition, alpha is most often set to 0.05. Thus, a p-value of 0.045 might be classified as statistically significant while a p-value of 0.055 might not. P-values should be presented as they are rather than just stating if a finding was statistically significant or not.
In summary, the level of significance (alpha) is a fixed limit that is determined in advance of the inferential statistics is calculated. The level of significance is not calculated, it is a decision determined on the basis of the safety margin you want to make a Type I error. The p-value however is calculated and depends on our observations.
Suggested reading
- Choosing statistical analysis
- Regression and correlation
- (The menus and sub-menus above)
References
(This section is still under construction. Sorry for the inconvenience.)